
|
Registered Kansas Voters
as of February 1, 2024
1,960,185
registered voters statewide.
-0.7% since the 2022 general election.
+1.5% since the 2020 general election.
|
870,438 (44.4%) are registered as Republicans.
504,251 (25.7%) are registered as Democrats.
24,115 (1.2%) are registered as Libertarians.
1 (0.0%) are registered as No Labels Kansas.
561,380 (28.6%) are not registered with any party.
|
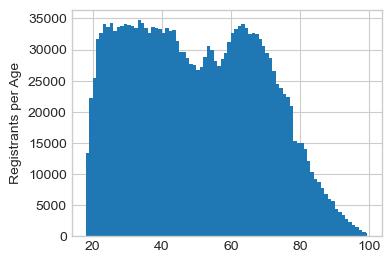
Age distribution of voters.
|
1,020,305 (52.1%) are listed as men.
928,973 (47.4%) are listed as women.
|
According to estimation*:
78.7% are non-Hispanic White.
5.6% are non-Hispanic Black.
2.0% are non-Hispanic Asian.
7.7% are Hispanic.
|
There were 5,557 new registrations last month.
45.6% women, 52.3% men.
38.8% Republican, 15.2% Democrat,
1.6% Libertarian, 44.5% unaffiliated.
74.3% NH White, 5.8% NH Black,
2.6% NH Asian, 11.2% Hispanic.
Average age: 33.6.
|
3,841 people left the rolls last month.
51.3% women, 48.4% men.
46.7% Republican, 29.6% Democrat,
1.1% Libertarian, 22.6% unaffiliated.
81.5% NH White, 5.8% NH Black,
1.1% NH Asian, 5.5% Hispanic.
Average age: 66.2.
|
View other snapshots:
May 1, 2026
April 1, 2026
March 2, 2026
February 3, 2026
January 5, 2026
December 1, 2025
November 3, 2025
October 3, 2025
September 3, 2025
August 1, 2025
July 1, 2025
June 2, 2025
May 2, 2025
April 2, 2025
March 3, 2025
February 3, 2025
January 2, 2025
December 2, 2024
November 4, 2024
October 1, 2024
September 5, 2024
August 2, 2024
July 1, 2024
June 4, 2024
May 1, 2024
April 1, 2024
March 1, 2024
January 2, 2024
December 5, 2023
|
View registration stats for:
Counties
School Districts
Congresional Districts
State Senate Districts
State House Districts
State Board of Education Districts
|
|


