The 2024 Kansas Presidential Primary
Brian Amos
Assistant Professor, Wichita State University
July 11, 2024
The presidential preference primary in Kansas was held on March 19th, and while
it was technically a contested election for both parties, the winners in both races
were already settled. Because of this, the election itself did not get much attention,
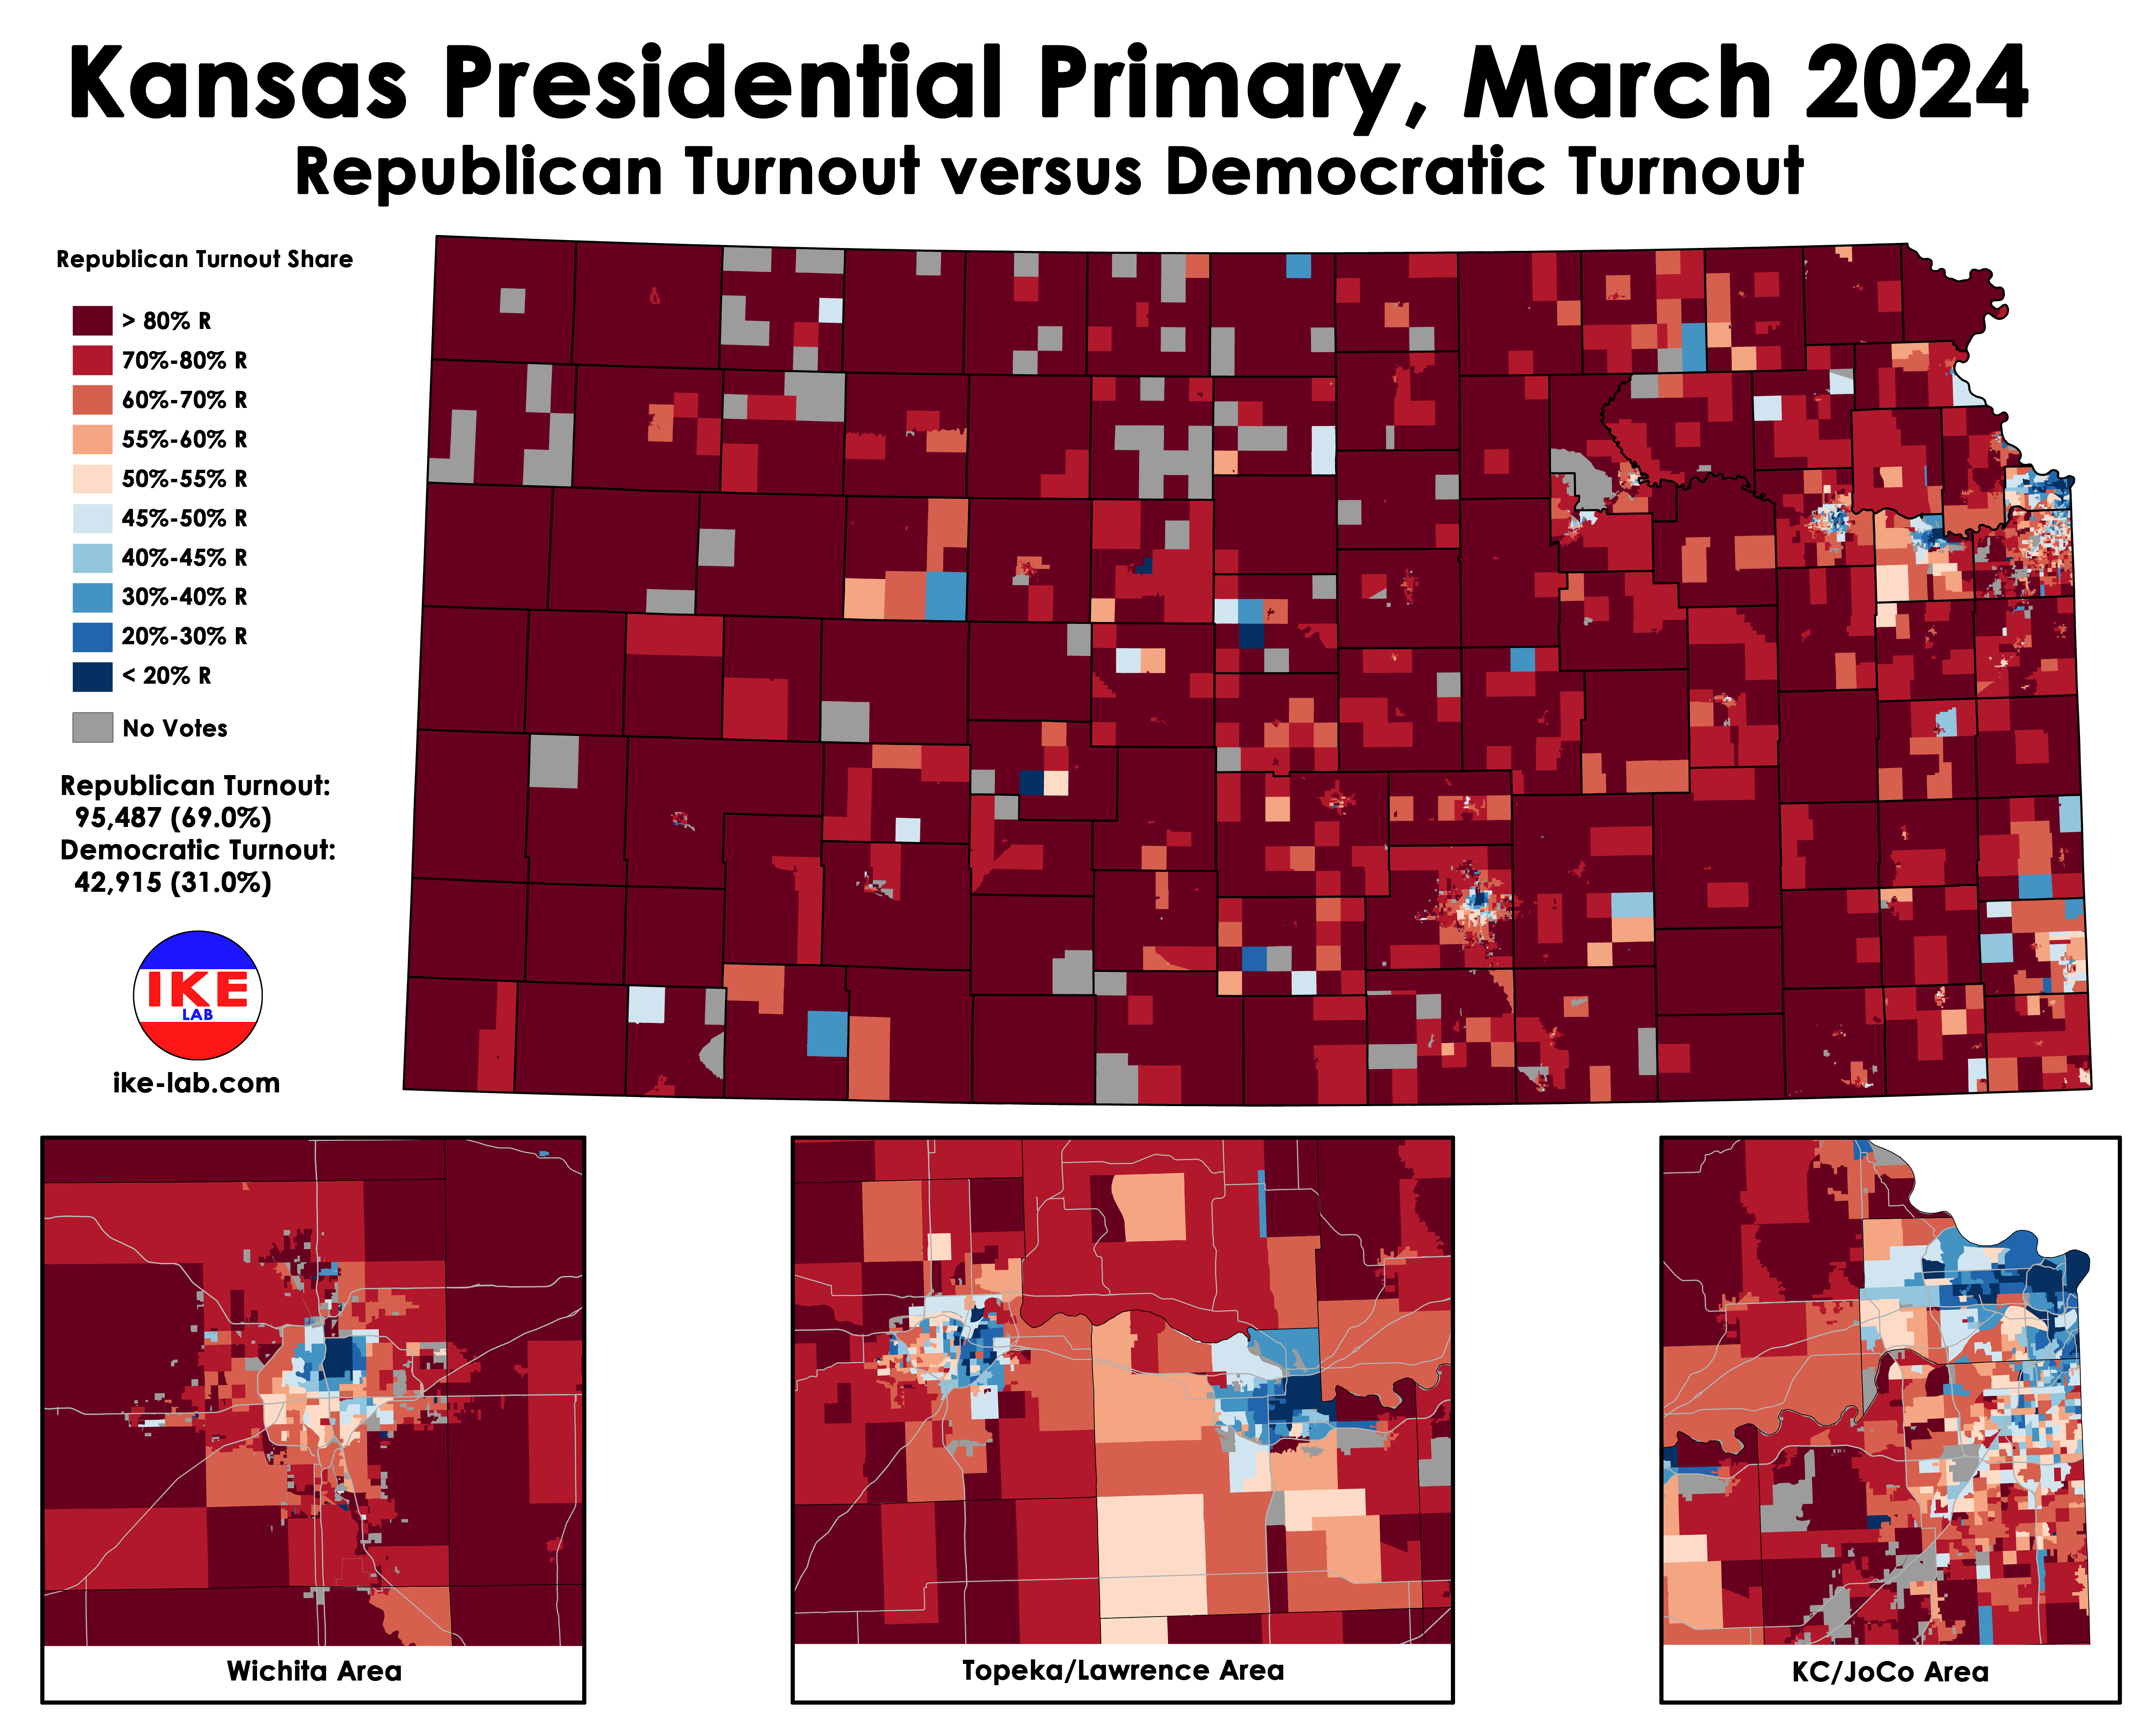
and the results were no surprise: Joe Biden easily won the Democratic contest with 83.7% of the vote,
and Donald Trump easily won the Republican contest with 75.5% of the vote.
We have results broken down by a number of different geographies (e.g., counties, state house
districts) over on our election results page. A precinct-level map
of the total Republican vote versus total Democratic vote is below (click to enlarge).
The balance of votes cast in the Republican primary versus the Democratic primary tracked very closely
to the shares cast for Biden and Trump in the 2020 general election. To make the comparison,
we grouped election results into Census tracts, which are units
of geography that are roughly the same size, with populations in the several thousands. The correlation between
the two elections was r = 0.94. We can run a regression predicting Democratic share in the primary using
the Democratic share in 2020, and we get a coefficient of 1.002 and an intercept of -0.086. In other words,
if you know how Biden did in 2020, you can predict the Democratic share in 2024 by subtracting about 9%.
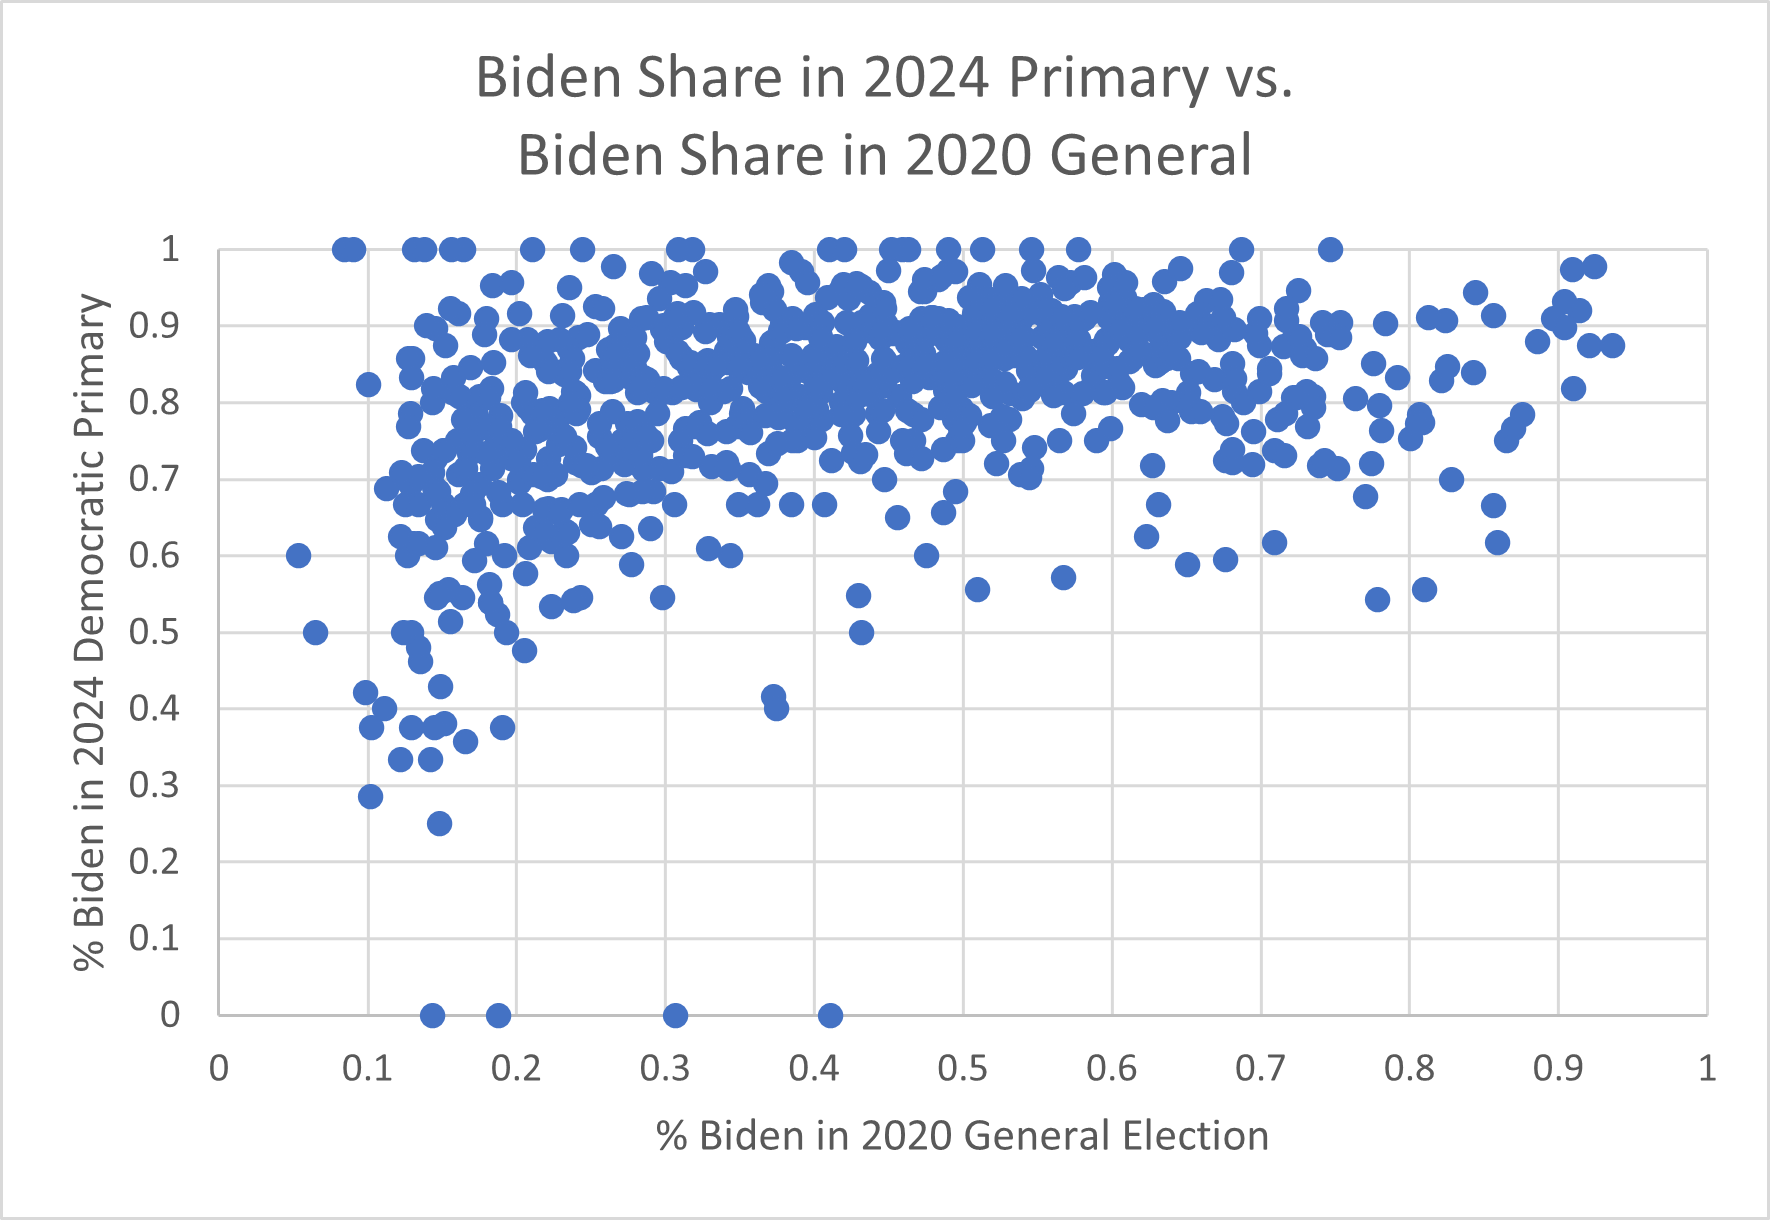
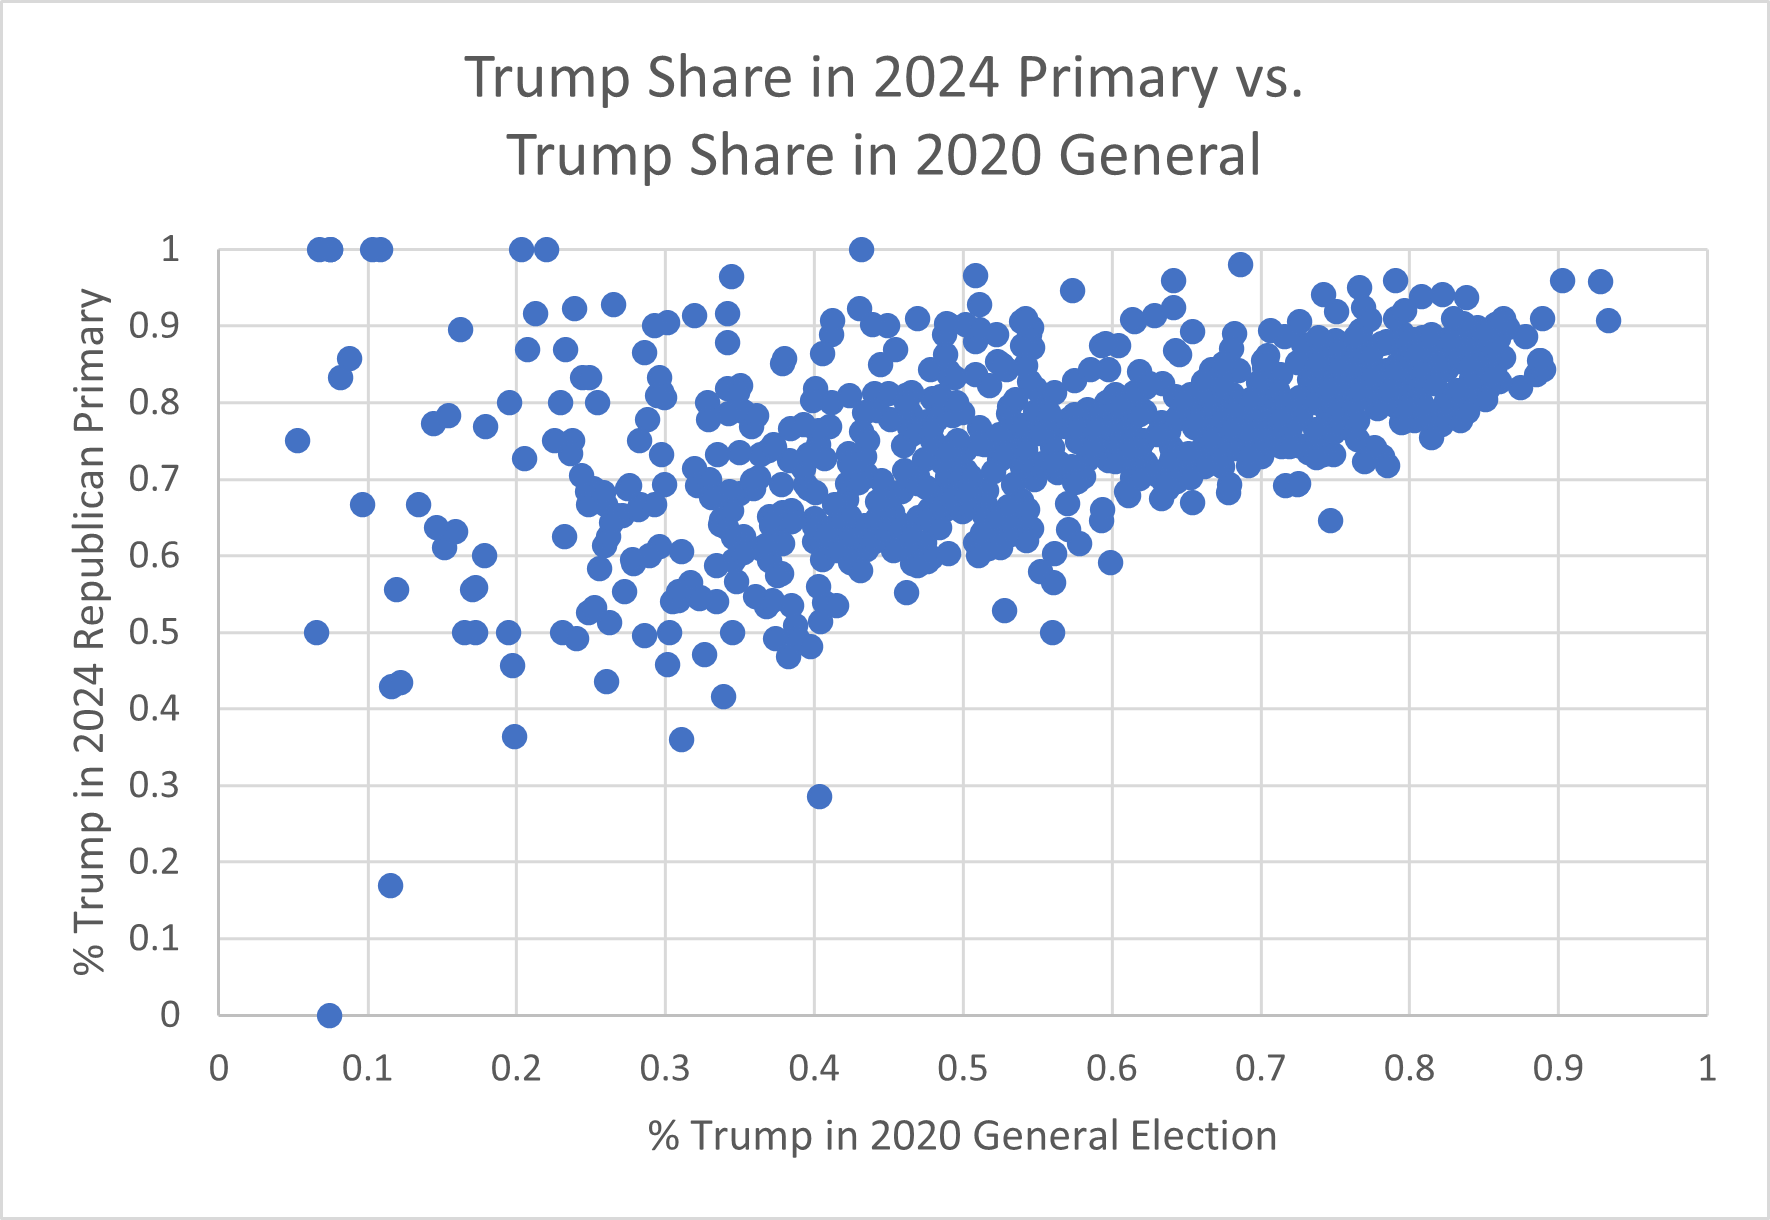
We can also make a comparison between performance for Biden and Trump in each primary to their performance
in the 2020 general election. As can be seen in
the charts below, Biden did worst relative to the other names on the Democratic ballot in tracts where he
received less than 30% of the vote in 2020, but above
that line his support was relatively level. In contrast, Trump's support in the primary continued to grow
across all levels of vote share in 2020.
As said before, there was not much attention given to this election, and this translated
into a lack of turnout. Looking across all registered
voters, only 7.1% turned out to vote. Unaffiliated voters could declare a party on
election day and cast a vote, but it may be more realistic to look at turnout just among
previously registered Democrats and Republicans: for Democrats registered before election day,
turnout was 8.3%, for Republicans it was 10.6%, and for Democrats and Republicans
combined, it was 9.8%. A county breakdown of these categories appears at the bottom
of this page. (You can click the links at the top of each column to sort.)
We can break down turnout by various demographic categories. The first is age: there was
a massive disparity in turnout between younger and older voters. 17.3% of registrants
age 65 or older voted in the primary, but only 1.5% of those under 40. Granted, younger
voters are less likely to be registered with a party, but the disparity is still stark when
we just look at turnout among registered Democrats and Republicans: 20.1% for 65+,
2.3% for under 40.
Two graphs illustrating this trend appear below: on the left is the age distribution of registered
voters for the election, and on the right is the age distribution of people who cast a ballot.
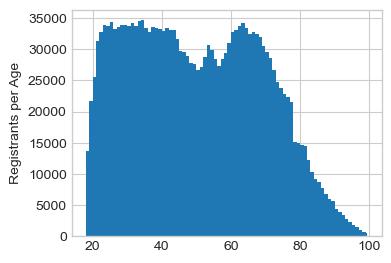
Age distribution of registered voters in March 2024.
|
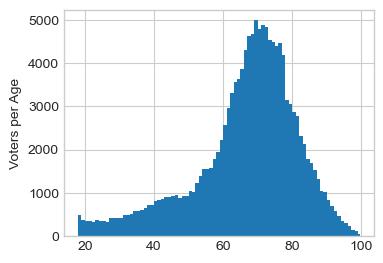
Age distribution of voters in the 2024 presidential primary.
|
Looking at gender, we see the normal trend of slightly higher turnout among women: they
turned out at 7.6%, while 6.5% of men registered to vote cast a ballot. We can
also estimate the racial turnout using surname matching and Census statistics. Given the county
turnout statistics, it might not be a surprise to see that Hispanic turnout was especially low,
at 3.3%, while white turnout was 7.6% and black turnout was 6.4%.
County Turnout Statistics
|
County
|
Dem Turnout
|
Rep Turnout
|
Dem+Rep Turnout
|
Overall Turnout
|
| Statewide
| 8.3% |
10.6% |
9.8% |
7.1% |
|
|
| Allen |
6.9% |
9.2% |
8.7% |
6.1% |
| Anderson |
8.2% |
9.0% |
8.8% |
6.3% |
| Atchison |
9.5% |
10.4% |
10.1% |
6.6% |
| Barber |
7.2% |
14.7% |
13.8% |
12.3% |
| Barton |
6.3% |
10.8% |
10.0% |
7.6% |
| Bourbon |
5.0% |
7.0% |
6.4% |
4.4% |
| Brown |
9.2% |
13.3% |
12.5% |
9.4% |
| Butler |
7.1% |
9.3% |
8.8% |
6.3% |
| Chase |
10.8% |
20.1% |
17.8% |
15.5% |
| Chautauqua |
14.6% |
16.8% |
16.6% |
13.2% |
| Cherokee |
9.2% |
10.1% |
9.8% |
6.7% |
| Cheyenne |
8.7% |
10.7% |
10.5% |
8.9% |
| Clark |
16.2% |
22.6% |
21.7% |
18.2% |
| Clay |
7.4% |
11.9% |
11.3% |
9.3% |
| Cloud |
15.7% |
15.0% |
15.1% |
12.0% |
| Coffey |
7.8% |
14.4% |
13.4% |
10.7% |
| Comanche |
17.9% |
27.9% |
26.8% |
23.7% |
| Cowley |
9.3% |
12.2% |
11.4% |
8.3% |
| Crawford |
8.4% |
8.0% |
8.2% |
5.3% |
| Decatur |
13.3% |
15.2% |
15.0% |
12.9% |
| Dickinson |
9.4% |
12.3% |
11.8% |
8.9% |
| Doniphan |
8.1% |
13.6% |
12.8% |
9.7% |
| Douglas |
10.0% |
11.2% |
10.4% |
7.6% |
| Edwards |
10.2% |
15.6% |
14.6% |
12.2% |
| Elk |
11.3% |
17.7% |
16.8% |
13.9% |
| Ellis |
7.2% |
9.4% |
8.8% |
6.5% |
| Ellsworth |
14.4% |
14.0% |
14.1% |
11.3% |
| Finney |
2.9% |
8.2% |
6.3% |
4.1% |
| Ford |
3.6% |
10.2% |
7.8% |
5.2% |
| Franklin |
7.2% |
10.4% |
9.6% |
7.1% |
| Geary |
5.9% |
8.1% |
7.3% |
4.7% |
| Gove |
10.0% |
12.4% |
12.1% |
10.1% |
| Graham |
6.1% |
12.5% |
11.7% |
9.3% |
| Grant |
4.0% |
9.3% |
8.4% |
6.5% |
| Gray |
9.1% |
11.2% |
10.9% |
8.7% |
| Greeley |
7.1% |
15.4% |
14.9% |
14.9% |
| Greenwood |
10.3% |
11.7% |
11.5% |
8.7% |
| Hamilton |
4.3% |
7.6% |
7.2% |
5.5% |
| Harper |
10.5% |
13.4% |
13.0% |
10.6% |
| Harvey |
10.2% |
12.7% |
11.9% |
9.1% |
| Haskell |
1.8% |
12.3% |
10.9% |
8.6% |
| Hodgeman |
13.7% |
16.0% |
15.7% |
13.4% |
| Jackson |
8.3% |
11.6% |
10.7% |
7.9% |
| Jefferson |
8.0% |
9.9% |
9.4% |
6.9% |
| Jewell |
3.4% |
13.6% |
12.6% |
12.6% |
| Johnson |
7.4% |
9.0% |
8.3% |
6.3% |
| Kearny |
5.3% |
14.6% |
13.1% |
9.6% |
| Kingman |
13.7% |
11.6% |
12.0% |
9.3% |
| Kiowa |
6.2% |
15.1% |
14.2% |
12.6% |
| Labette |
8.5% |
11.7% |
10.7% |
7.1% |
| Lane |
13.6% |
16.7% |
16.4% |
14.2% |
| Leavenworth |
6.9% |
8.6% |
8.0% |
5.5% |
| Lincoln |
8.4% |
12.9% |
12.3% |
10.6% |
| Linn |
7.6% |
11.2% |
10.5% |
8.1% |
| Logan |
10.8% |
12.6% |
12.4% |
10.1% |
| Lyon |
7.6% |
11.3% |
9.9% |
6.7% |
| Marion |
11.7% |
13.3% |
13.0% |
10.2% |
| Marshall |
12.2% |
11.3% |
11.5% |
8.7% |
| McPherson |
12.2% |
13.1% |
12.9% |
9.8% |
| Meade |
5.6% |
9.9% |
9.4% |
9.4% |
| Miami |
7.3% |
8.1% |
7.9% |
5.8% |
| Mitchell |
11.2% |
12.8% |
12.6% |
10.6% |
| Montgomery |
6.7% |
11.1% |
10.0% |
7.5% |
| Morris |
13.0% |
21.0% |
19.5% |
14.6% |
| Morton |
4.2% |
10.3% |
9.5% |
7.7% |
| Nemaha |
9.6% |
11.6% |
11.3% |
8.9% |
| Neosho |
6.3% |
9.5% |
8.7% |
6.0% |
| Ness |
10.8% |
9.0% |
9.2% |
7.9% |
| Norton |
5.7% |
13.0% |
12.1% |
9.8% |
| Osage |
4.3% |
5.9% |
5.5% |
4.0% |
| Osborne |
8.3% |
14.7% |
13.7% |
11.0% |
| Ottawa |
8.8% |
11.3% |
11.0% |
9.4% |
| Pawnee |
12.5% |
16.0% |
15.4% |
12.1% |
| Phillips |
9.4% |
14.1% |
13.7% |
11.3% |
| Pottawatomie |
6.4% |
8.7% |
8.3% |
6.7% |
| Pratt |
8.4% |
11.7% |
11.2% |
9.3% |
| Rawlins |
9.8% |
16.5% |
15.8% |
13.4% |
| Reno |
7.5% |
10.8% |
9.9% |
7.1% |
| Republic |
10.1% |
12.2% |
12.0% |
9.9% |
| Rice |
9.2% |
9.0% |
9.1% |
7.0% |
| Riley |
8.4% |
10.9% |
9.9% |
6.9% |
| Rooks |
9.4% |
15.2% |
14.6% |
12.3% |
| Rush |
9.0% |
18.3% |
17.1% |
14.4% |
| Russell |
15.2% |
11.1% |
11.6% |
9.6% |
| Saline |
8.3% |
13.0% |
11.7% |
8.2% |
| Scott |
5.3% |
11.0% |
10.4% |
8.1% |
| Sedgwick |
8.6% |
10.5% |
9.8% |
6.5% |
| Seward |
1.7% |
7.2% |
5.2% |
3.4% |
| Shawnee |
11.1% |
13.1% |
12.2% |
8.4% |
| Sheridan |
9.1% |
12.4% |
12.0% |
10.4% |
| Sherman |
3.8% |
8.7% |
8.1% |
6.5% |
| Smith |
5.4% |
13.0% |
12.1% |
10.3% |
| Stafford |
15.5% |
21.7% |
20.9% |
17.1% |
| Stanton |
3.9% |
11.8% |
10.6% |
9.0% |
| Stevens |
1.7% |
7.8% |
7.2% |
6.0% |
| Sumner |
6.3% |
8.8% |
8.2% |
5.9% |
| Thomas |
12.7% |
14.7% |
14.5% |
11.5% |
| Trego |
14.7% |
14.4% |
14.4% |
11.8% |
| Wabaunsee |
10.6% |
13.8% |
13.3% |
10.7% |
| Wallace |
9.1% |
12.5% |
12.3% |
10.7% |
| Washington |
9.2% |
12.9% |
12.6% |
11.2% |
| Wichita |
13.0% |
18.3% |
17.7% |
13.6% |
| Wilson |
6.8% |
4.6% |
4.9% |
4.0% |
| Woodson |
9.1% |
13.3% |
12.7% |
10.2% |
| Wyandotte |
9.4% |
11.1% |
9.9% |
6.8% |
|